Guide · Blog Post
Reporting Across Dozens of monday.com Boards: Why Dashboards Hit a Wall, and How to Get One Report You Can Trust
One board per client or per project is how most teams set up monday.com, and it works well until leadership asks a simple question: across everything, what is late, who is overloaded, and how does this month compare to last? Dashboards answer that for a handful of boards. Past that, the answer turns into someone exporting to Excel every Friday. This is where native reporting stops, and the two patterns I use to get one report that covers every board and stays current on its own.
By Mehadi Hasan 7 min read
1. The questions dashboards stop answering
These are the requests I hear from operations leads and agency owners once an account grows:
- "Show me every overdue task across all clients." The work sits on 80 client boards, not one.
- "Who is overloaded next week?" Workload has to count every board a person is assigned on, including the ones created last Tuesday.
- "Are we getting faster?" Trends need history, but a board only shows how things look right now.
- "One status per project, for the exec meeting." Leadership wants a row per project with health, % complete, and next deadline, not a widget per board.
When native reporting cannot answer these, the fallback is always the same: exports, a spreadsheet, and one person who loses half a day every week rebuilding a report that is out of date by Monday.
2. Where monday.com dashboards stop
A dashboard can only read so many boards
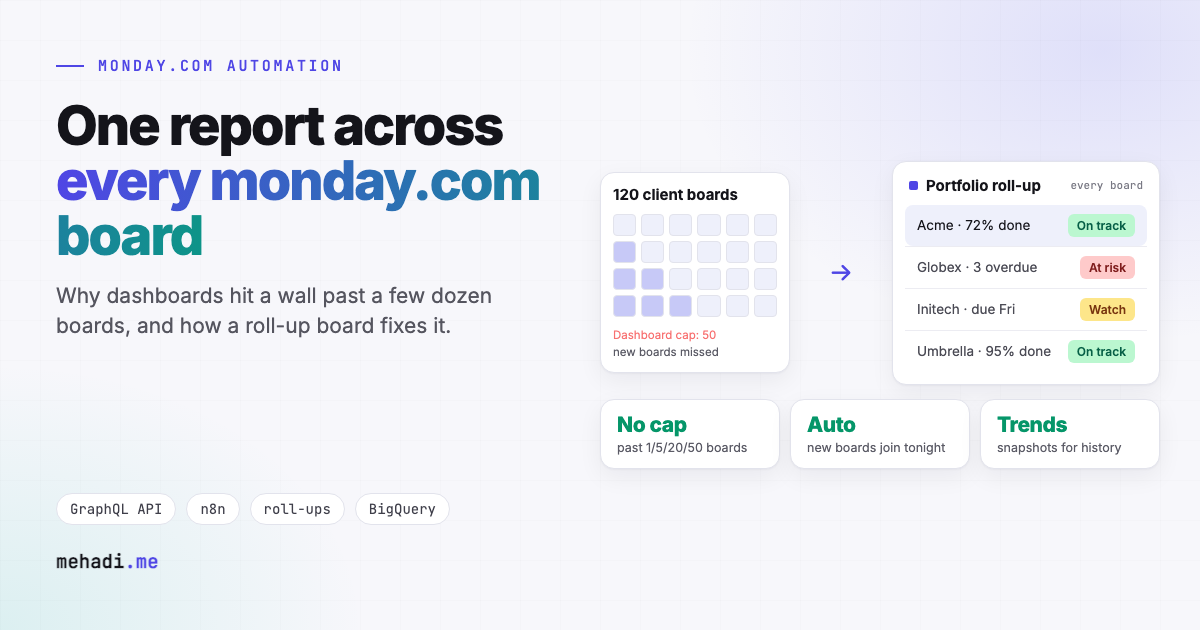
monday.com's developer documentation lists connected boards per dashboard as 1, 5, 20, and 50 on Basic, Standard, Pro, and Enterprise, with up to 30 widgets per dashboard and 20,000 items per widget (platform limits). An agency with 120 client boards cannot put them all behind one dashboard on any plan, and users have been asking for higher limits for years (community thread, another).
New boards do not join the report by themselves
Each widget lists the boards it reads. When a new client or project board is created from a template, someone has to remember to add it to every widget, and a long-running community request asks for exactly that to happen automatically (feature request). Forget once and the report quietly undercounts.
Boards must look alike to be reported together
Cross-board widgets work best when every board uses the same columns and labels. If one team renamed "Due date" to "Deadline" or added a "Blocked" label nobody else uses, numbers split or vanish. The bigger the account, the less alike the boards are.
No history, so no trends
Dashboards read current values. "How many items were overdue each week this quarter" needs a snapshot taken every week, and that snapshot has to be stored somewhere monday.com does not provide.
Mirror-based roll-ups are fragile
A master board that mirrors values from every project board runs into connected-board caps and shows blank cells to anyone missing access to one board in the chain. I cover those limits in monday.com Connect Boards and automation limits.
3. Fix one: a roll-up board that writes real values
Instead of asking a dashboard to read 120 boards, an automation reads them and writes one summary row per board, or per project, onto a single portfolio board. Every dashboard then reads one board, which fits every plan.
- Discover boards automatically. The workflow lists boards by workspace, folder, or naming rule through the GraphQL API (boards query), so a board created from the template this morning is in tonight's report without anyone touching a widget.
- Normalise as it reads. A small mapping says that "Deadline" on one board and "Due date" on another are the same thing, and that "Blocked" and "Stuck" both count as at risk. Messy boards stop breaking the numbers.
- Write real columns. Each summary row gets numbers and statuses such as open items, overdue items, % complete, next deadline, owner, and a health status. Because they are real columns, not mirrors, they sort, filter, group, feed formulas, and trigger native automations, for example "when health changes to At risk, notify the account lead".
- Stay current two ways. Webhooks update a row when something important changes, and a scheduled pass, nightly or every few hours, recalculates everything so nothing drifts.
- Alert on failure. If a board cannot be read, the run posts the board and the error to Slack instead of quietly reporting zero.
This is the same pattern I run in production for an agency, where project boards are realigned with the task boards beneath them on daily and 6-hour schedules (board sync case study).
4. Fix two: snapshots in a database, for history and real BI
When the questions are about trends, utilisation, or joining monday.com data with finance or CRM data, the data belongs in a database.
- Nightly extract. n8n pages through every item on every relevant board with cursor pagination and writes it to Postgres or BigQuery, one row per item per day.
- One clean schema. Different boards feed the same tables through the same mapping, so a report does not care which board an item came from.
- Any reporting tool. Looker Studio, Power BI, or Metabase reads the tables. Overdue-by-week, cycle time, and hours by client become simple charts.
- Optional AI summary. Each Monday, Claude reads what changed and posts a short written summary to Slack or email: which projects slipped, which recovered, and why, based on item updates.
I have built this shape of pipeline outside monday.com too: unattended bots that pull billing data from two utility providers into one shared PostgreSQL schema for unified reporting (case study). For the API details, see using the monday.com GraphQL API with n8n.
5. Which one you need
- Fewer boards than your plan's dashboard cap, all built from one template: a native dashboard is enough. Lock the template so columns stay consistent.
- More boards than the cap, or boards that differ, and people want to act inside monday.com: a roll-up board.
- Trends, utilisation, or joining with other systems: a snapshot database, often alongside the roll-up board.
Either way, the weekly export stops, and the number leadership sees is the same number the team sees.
Leadership still waiting on a Friday spreadsheet?
Tell me how many boards you report across and the three questions leadership keeps asking. I will reply within 24 hours with whether a dashboard can answer them, or how a roll-up board or reporting database would work and roughly what it takes. See my monday.com automation service.
Get a free 30-min automation auditFrequently asked questions
How many boards can a monday.com dashboard show?
monday.com's developer documentation lists 1, 5, 20, and 50 connected boards per dashboard on Basic, Standard, Pro, and Enterprise, with up to 30 widgets per dashboard.
How do you report across more boards than a dashboard allows?
With a roll-up board. An automation reads every relevant board through the API and writes one summary row per board or project, with real columns such as open items, overdue items, % complete, and health. Dashboards then read that one board.
Can monday.com show trends over time?
Dashboards show current values. For trends, a nightly job saves a snapshot of every item to a database such as Postgres or BigQuery, and a tool like Looker Studio or Power BI charts it.
Do new boards get added to the report automatically?
Not in native dashboards: each widget lists its boards. A roll-up automation can find boards by workspace, folder, or naming rule, so new boards are included on the next run.
Limits checked November 3, 2026 against the monday.com developer documentation and community threads linked above. monday.com changes plans and limits often; confirm current details for your plan before you build.